
The City as an Operating Environment
Flows / Space / Power / Data
3.1Four domains, one operating surface
When a fleet of autonomous vehicles enters a city, it encounters a complex operating environment with a unique geography, incumbents, political economy, and constraints. Decades of decisions have created path dependencies that will shape future outcomes.
This chapter organizes the operating environment into the four domains of the Institutional ODDInstitutional ODDThe governance counterpart to the technical ODD: the conditions a city has to put in place — in rules, instruments, sensing, and authority — for CAM to operate inside its boundaries on terms the city can live with. Answers where the city can govern. (Ch.2, Box 2.1.): Flows, Space, Power, and Data. CAM will affect each in specific ways that we can anticipate. Each has a specific limiter – the point at which the diffusion of urban autonomy will exceed the domain’s capacity, making the governance gap visible.
3.2Flows: movement rights and priority
“Flows” refers to who moves, when, where, and with what priority in the public right of way. Today this is managed through a patchwork of familiar instruments: traffic signals, lane designations, bus priority corridors, freight restrictions, speed limits, turning bans, and access controls. Each was developed for a world in which the dominant road users were privately owned cars and commercially operated goods vehicles, with public transport, pedestrians and bicycles occupying structurally privileged positions through dedicated lanes and signal priority.
Conventional traffic-engineering instruments are calibrated for the predictable rhythms of commuter peak, off-peak, and weekend variation. In the case of urban autonomy, fleet routing optimization protocols can amplify, dampen, or simply ignore these patterns depending on the operator’s incentives.
A fleet operator optimizing for commercial efficiency will route vehicles to minimize journey time and fuel cost. There is no inherent incentive to account for impacts on other road users or on residential areas. Without intervention, the routing logic of private fleets becomes, by default, the city’s traffic management protocol. Waze and Google Maps have already demonstrated this effect at scale. In several high-profile instances, the apps have routed vehicles through residential streets to avoid main-road congestion, creating rat-running patterns that no planning authority would have endorsed. There is a risk that autonomous fleets, with no driver cost constraint and continuous route optimization, will intensify this dynamic. Governance responses can include geofencing, routing restrictions, time-of-day access controls. Implementing them requires the legal authority and the technical capability to specify and enforce routing conditions – few cities are equipped to implement them.
Special events are a good way to understand the problem. The instruments for managing this kind of peak system load exist for buses, ride-hail, and emergency vehicles; they do not yet exist for autonomous fleets. Austin’s transportation and public works department reports that during major festivals like South by Southwest, or Austin City Limits, Waymo vehicles accumulate in congestion clusters. No party, operator or municipality, has the capacity to geofence in real time. The same dynamic appears in any city with a major recurring event.
The solution is dynamic controls over operating conditions. These are a way for the city to instruct an operator to alter its routing, restrict its curb access, or pause its dispatch during a defined window. Some “event mode” changes apply to the road network in general – closures, zones – while others operate as instructions to a particular operator’s dispatch. Most event-mode instruments are the second kind. For that reason, event mode controls are both a technical integration problem and a licensing one. Event mode governance is not the same as steady-state governance; the licensing framework must accommodate both.
Managing the relationship between standard and autonomous traffic matters outside of peak events, of course. When ride hailing services were scaling, TNCs in San Francisco accounted for 47-55% of all congestion growth between 2010 and 2016EV23EV23Connected Autonomous Mobility (CAM) and Induced Demand: Evidence on VMT and CongestionAV/CAM deployment risks 4–60% VMT increase via empty repositioning, longer commutes, modal shift; congestion gains hinge on platooning density and…Open in the Evidence Base →. In New York, TNCs added an estimated 600 million vehicle miles per yearEV23EV23Connected Autonomous Mobility (CAM) and Induced Demand: Evidence on VMT and CongestionAV/CAM deployment risks 4–60% VMT increase via empty repositioning, longer commutes, modal shift; congestion gains hinge on platooning density and…Open in the Evidence Base → to the network, with roughly a third of those miles being empty vehicles repositioning for their next trip rather than carrying passengers. Autonomous vehicles, which remove driver cost as a constraint on vehicle utilization, are modeled to increase vehicle miles traveledVMT (Vehicle Miles Traveled)Total distance driven across a fleet or area, the standard measure of road demand. Central to the paper because autonomous fleets are modelled to increase VMT — by around 6 percent on the peer-reviewed central estimate, across a 4 to 60 percent range depending on occupancy and pricing assumptions, with empty repositioning alone able to double city-wide miles. Empty repositioning miles are still miles. (Ch.3.) (VMT), though estimates vary widely: a 2026 meta-analysis of 26 studies puts the average increase near 6 percentEV57EV57Meta-Analysis Confirms AV Deployment Will Increase VMT ~6%; Empty Miles Could Double Daily Travel (March 2026)Peer-reviewed meta-analysis: AVs increase VMT ~6%; empty repositioning miles could double city-wide daily travelOpen in the Evidence Base →, scenario studies range from 10 percent to 50 percent or moreEV23EV23Connected Autonomous Mobility (CAM) and Induced Demand: Evidence on VMT and CongestionAV/CAM deployment risks 4–60% VMT increase via empty repositioning, longer commutes, modal shift; congestion gains hinge on platooning density and…Open in the Evidence Base →, and the same 2026 research finds that empty repositioning miles could as much as double the miles a city’s population drives in a day. In the absence of policy intervention, the rate-limiter is road capacity.
Vehicle load management will be particularly important as historically distinct traffic systems start to blur. The same autonomous vehicleAV (Autonomous Vehicle)A vehicle capable of driving itself without a human operator. The paper mostly avoids "AV" in favour of CAM, because "autonomous vehicle" frames the subject as a machine when the governable object is a networked commercial service. (Ch.2.) platform that carries a commuter in the morning may carry a parcel at midday and a restaurant delivery in the evening. The implications for peak management, curb allocation, freight access controls, and transit interaction are significant: instruments calibrated for one type of vehicle will produce unintended consequences when applied to a platform that can switch between functions.
Cyclists and pedestrians do not move as vehicles do; their motion is irregular, behaviorally variable, weather-sensitive, and less predictable than vehicles. A 2018 pedestrian fatality in Tempe has cast a long shadow over the issue of preemptionPreemptionWhere a higher tier of government removes a lower tier’s authority to regulate a subject. Texas SB 2807, making the operator a state licensee, is the paper’s worked example: a city can lose the power to set conditions without losing any obligation to absorb the consequences. (Ch.2.). The recurring curb-conflict and near-miss incidents documented across Waymo and Cruise operations in San Francisco since 2023 reflect the same underlying difficulty – the operational design domains of autonomous fleets and the operational reality of human movement patterns do not yet share a protocol.
Many cities have spent the past two decades re-prioritizing road space for cycling and active travel, using segregated infrastructure, intersection design standards, modal-priority signals, and brightly colored paint. The governance instruments protecting those investments do not automatically translate into the operating conditions of autonomous fleets. Vulnerable road userVRU (Vulnerable Road User)Pedestrians, cyclists, wheelchair users and anyone else outside a vehicle. The paper’s institutional question is whether VRU interaction performance becomes an operating condition attached to a licence, or is left to the operator’s own safety case. (Ch.3.) (VRU) interaction performance can be written into the fleet license, but for it to be effective, cities need the capability to measure, audit, and enforce. Without it, VRU interaction will accumulate as a risk to the city’s most exposed road users, and compounds the legitimacy risk to cities.
3.3Space: curbs, depots, and the politics of allocation
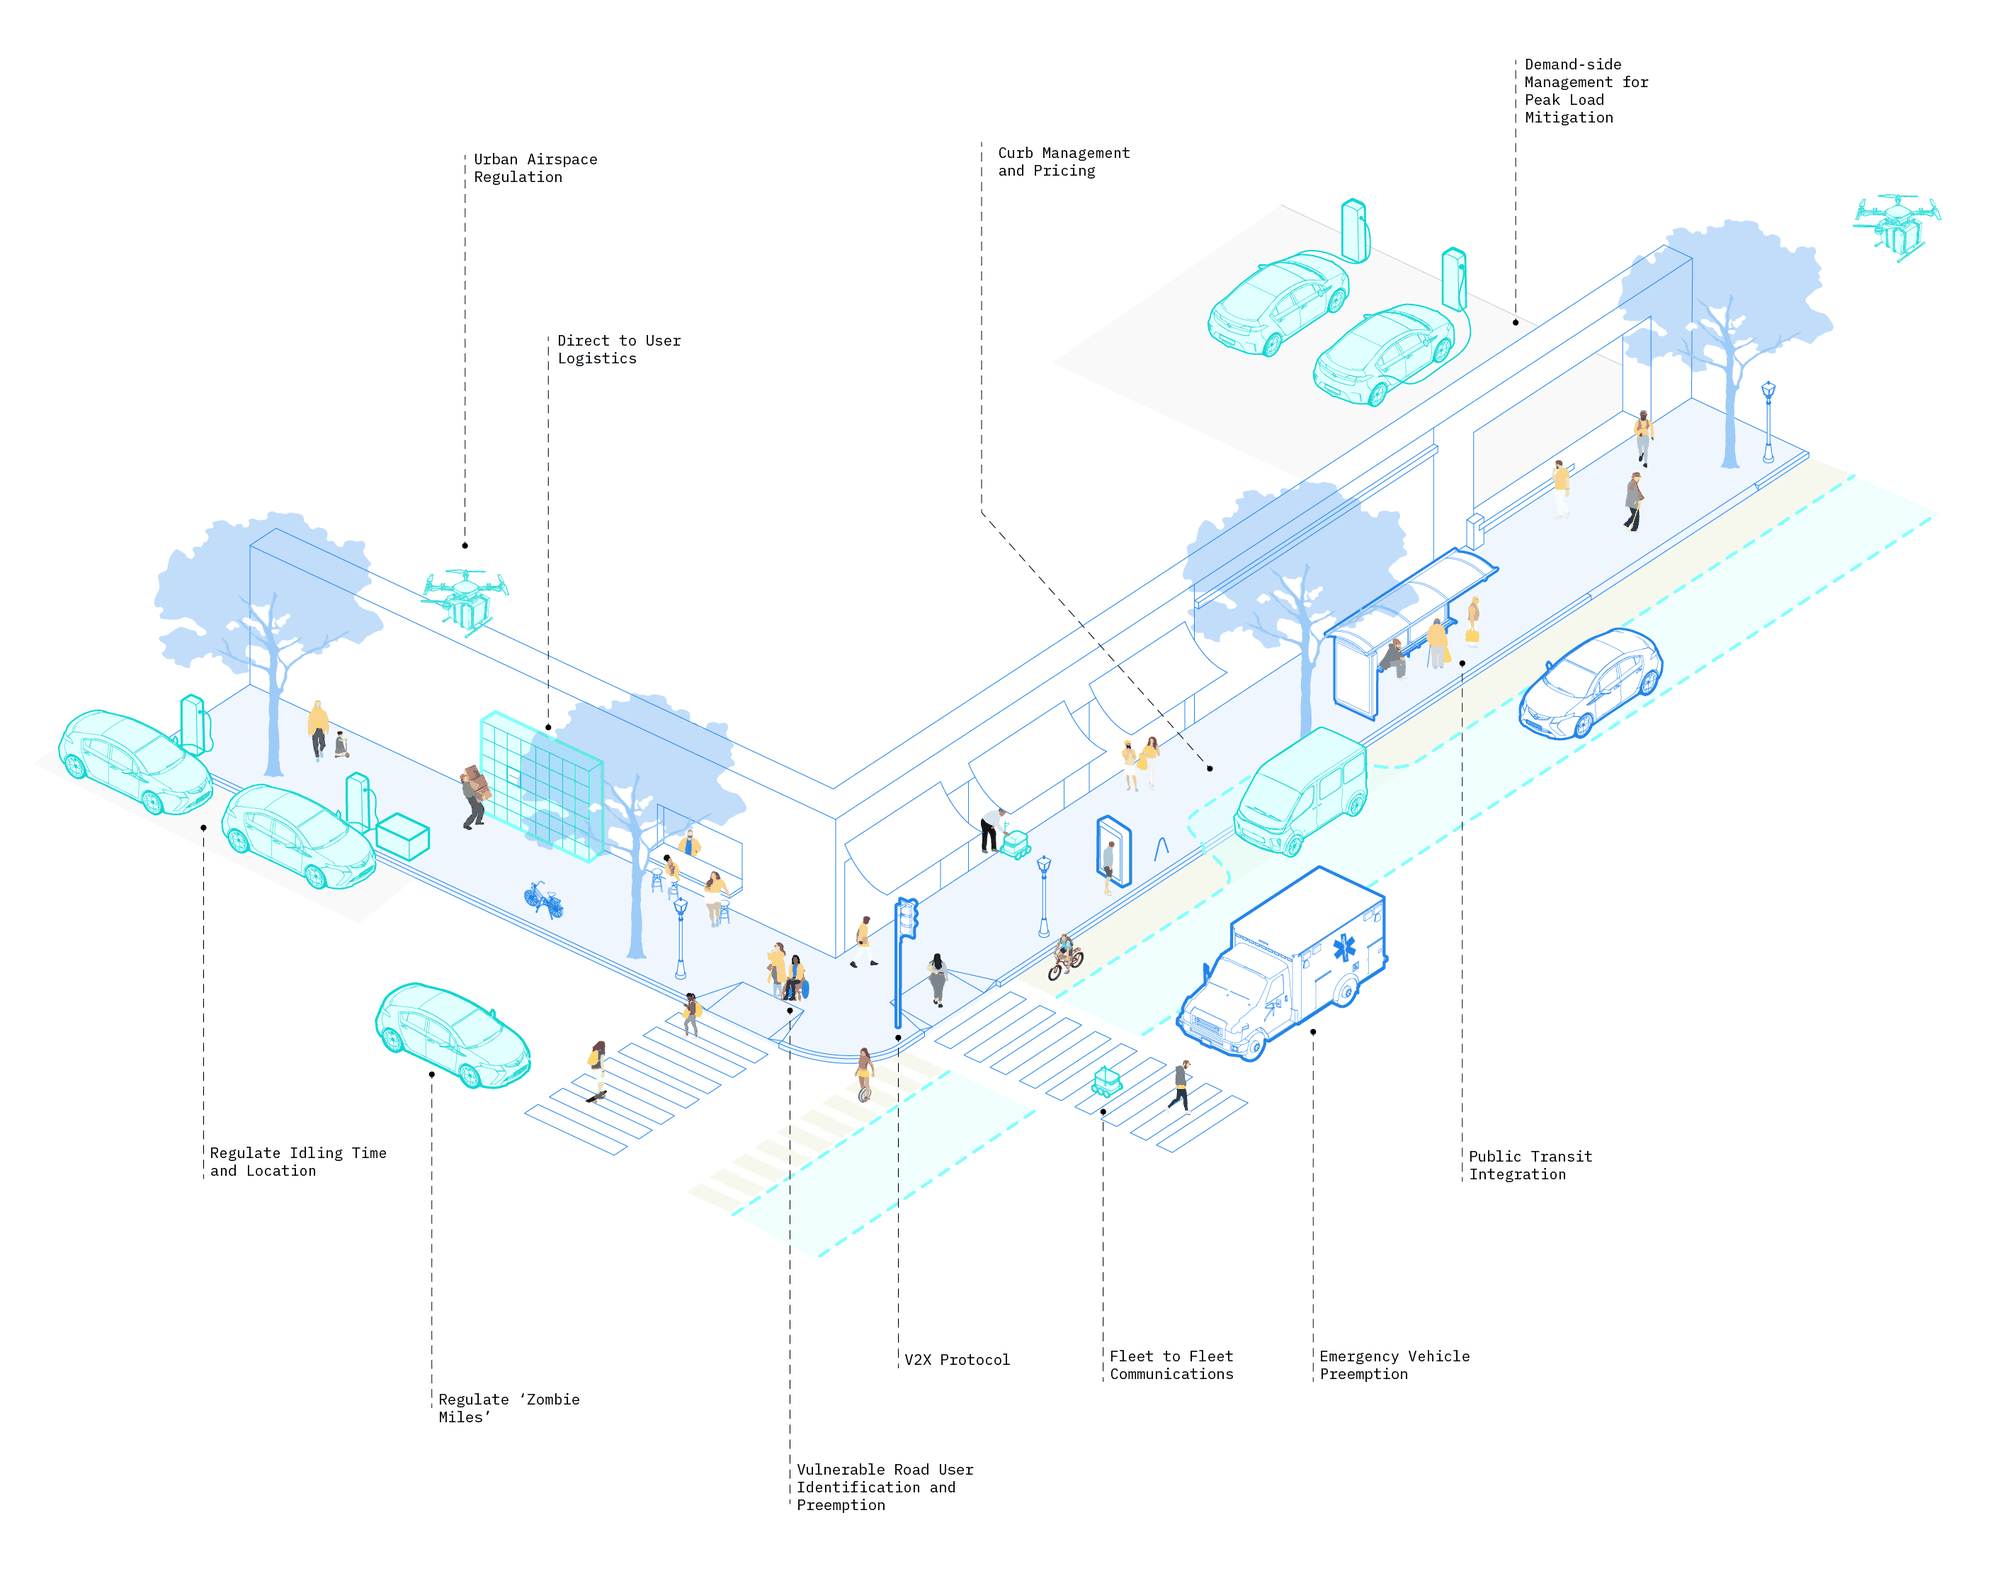
Space is the domain where CAMCAMConnected and Autonomous Mobility — the commercial deployment of autonomous vehicles operating connected to data and control networks. The paper uses CAM rather than "AV" to foreground the network and governance dimensions that determine how the technology lands in cities. (Ch.1 §1.1; Ch.2 §2.1.)’s impact will be most immediately visible and most politically contested. Every autonomous vehicle – whether it is a passenger robotaxi, a goods delivery platform, or a municipal service fleet – needs somewhere to pick up, drop off, charge, undergo maintenance, and idle before its next dispatch. Land, more than anything else in a city, is the subject of hotly contested claims from residents, businesses, organizations, freight operators, transit agencies, and pedestrians.
Today’s curb has a wide variety of uses: metered parking, residential bays, loading zones, bus stops, taxi ranks, priority spots for disabled users, cycle storage, charging, and more. It can be claimed for temporary uses, from block parties to moving day. Its allocation is the result of decades of negotiation between transport departments, planning authorities, parking enforcement agencies, elected officials, and organized interest groups. The curb is a sediment of history, and its intricacies are most visibly communicated through static signs that describe parking, street cleaning, truck loading, and prioritization. Few cities have detailed digital documentation of curb segments.
CAM demands a different approach to the curb: dynamic, demand-responsive, governed by real-time data instead of paint, signage, and back-room negotiation. The political economy of curb reallocation will be one of the most difficult governance challenges in urban management related to autonomy. Few cities have the technical and institutional capacity for dynamic curb management.
If curbs are the front line, depots are the home front. Industrial in scale (Chapter 7), and often in direct competition with other uses, depots have a large and long-term impact on communities. Siting determines which communities absorb operational externalities like noise, traffic, and electricity grid stress, and which communities receive the service benefits.
In most cities, curb management, depot planning, land-use regulation, and charging infrastructure permitting sit in different departments, have diverging success metrics, answer to different elected officials, and operate on incompatible planning cycles. No single agency can make rational allocation decisions across all four functions. The result is either fragmented decision-making or institutional paralysis, where no agency can move because none has sufficient authority to move without creating conflict with another.
3.4Power: energy as infrastructure constraint
Few city transportation authorities have addressed the link between the electricity grid and mobility planning. Electrifying autonomous fleets is a grid infrastructure commitment that requires planning decisions and physical investment on a decades-long timescale. It involves several different jurisdictional layers, including energy regulators, distribution network operatorsDNO (Distribution Network Operator)The regulated monopoly that owns and operates the local electricity distribution network in a UK region. Depot siting decisions fall in DNO areas rather than city boundaries, so a single operator’s fleet plan can require coordinated review across several networks. (Ch.3.), utility companies, and national grid operators. These organizations have limited existing relationships with the transport and planning agencies managing CAM deployment.
A depot needs a dedicated connection: a fleet of 100 autonomous electric vehicles draws approximately 2 megawatts under managed chargingManaged chargingShaping when a fleet charges so that demand falls outside network peaks, in exchange for lower cost or faster connection. The mechanism behind the paper’s "fleet as a battery" framing: a controllable load is an asset to the grid rather than a threat. (Ch.2.), equivalent to the load of a large commercial building, and around 4 megawatts if the whole fleet charges unmanaged in the same windowEV26EV26Unmanaged EV Charging: Peak Load Impact EvidenceEV unmanaged charging spikes grid peak load, threatening infrastructure capacity; core case for smart/managed charging mandatesOpen in the Evidence Base →. A depot scaled for a 500-vehicle fleet requires a dedicated grid connection in the range of 8 to 10 megawatts. In the UK, the realistic end-to-end timeline for a connection of this scale is fifteen to eighteen months: twelve months or more of application, design, and permitting, followed by three to six months of installation including the energization wait period.
Grid connections cannot be accelerated through political will alone: power has a hard physical limit. It takes time to dig up roads and install transformers. A city that begins planning depot charging infrastructure when the first commercial CAM fleet arrives will be two to three years behind from the first day (here, the pacing problem is a concrete operational constraint rather than an abstract institutional risk).
Connection costs for the dedicated infrastructure fall in the range of $130,000 to $250,000 (£100,000–200,000) 1 Figures are in US dollars throughout. Sterling and Singapore dollar amounts appear in parentheses where the underlying case is a UK or Singaporean precedent. Converted at £1 = $1.27 and SGD 1 = $0.74. , and distribution network upgrades – often required in urban areas where the local network was not designed for this concentrated load – can add costs that, in some cases, exceed half the total installation budget and must be funded by the connecting customer. These energy infrastructure costs are governed by regulators and distribution network operators whose planning cycles, commercial models, and reporting frameworks are entirely disconnected from those of transport authorities.
In land-constrained markets like London, Tokyo, the Dutch Randstad, and Singapore, 500-vehicle consolidated depots are unrealistic. The more probable operational pattern is distributed: multiple smaller depots, each requiring its own grid connection negotiation and planning consent. In these contexts, cooperative planning between transportation agencies and grid utilities must anticipate multi-site, multi-operator dynamics. Their tools should include depot siting concession processes and DNO coordination protocols.
The shape of the energy load matters, too. By default, autonomous vehicle fleets will have a stochastic profile. Because dwell time is forgone revenue for a robotaxi fleet and because the rate of charge is fastest between 20 and 80% battery, operators have an incentive to run fast, frequent, daytime charging. Vehicles will charge when they are spatially proximate to a depot, between 20 and 80% battery, and not on-call – that pattern is unpredictable, and plausibly coincides with peak demand on the grid (as opposed to the overnight charging profile typical of private vehicles).
In California, transport electrification happened faster than energy coordination. EV users began charging in late evening, when they returned from daily use, creating local distribution stress that the network was not designed to absorb.
Managed charging programs use incentives or rate hikes, or, in some cases, establish technical protocols for the grid to directly control end-user devices. The grid chooses when it will be burdened, rather than leaving the choice to consumers or vehicle operators. Managed charging programs have reported peak-demand reductions in the range of 35-45%EV27EV27Smart Charging and Managed Demand Response: Quantified ResultsSmart charging/managed demand response cuts peak grid load 20–40%, shifts EV demand off-peak; key lever for utility-AV integrationOpen in the Evidence Base →. A reduction of that order is the difference between a depot that can be permitted in an inner urban location and one that must be pushed to the urban fringe.
3.5Data: seeing the operating picture
Data is the domain that makes all the others governable. A city cannot price curb access, manage charging load, or enforce the priority of vulnerable road users without structured data on where fleets go and whom they serve. There is no mechanism for policy to improve over time.
Data is central to autonomy. Operators’ competitive advantage is, arguably, a function of their data, and the algorithms they build around it. To operate effectively, an autonomous vehicle fleet needs a detailed basemap of its operational domain, and the capacity to “see” current conditions in real time. A single Waymo vehicle generates on the order of 1.4 terabytes of sensor data per hour (Chapter 5). That is more information about road conditions, curb occupancy, pedestrian behavior, and traffic patterns than any city transport authority currently collects across its entire managed network, by orders of magnitude. Little, if any, of that data flows back to public agencies, where it could be used for a wide variety of long-term planning and real-time management.
In addition to the difference in quantity, there is a structural information asymmetry between autonomous fleet operators and public sector agencies. The operator can know how the city’s public infrastructure is performing in granular detail; the city knows almost nothing about how the operator’s fleet is behaving.
The technical infrastructure to close this gap already exists – data standards, spatial referencing systems, and privacy law are described in Chapter 5. What does not exist is a settled answer to the legal and institutional question of who has the right to require data, in what format, at what frequency, with what privacy protections, and with what enforcement mechanism for non-compliance.
The UK’s Automated Vehicles Act 2024 creates an institutional framework for safety data but leaves operational performance data undefined. Cities need information like fleet routing, curb dwell times, charging demand, and service distribution for long-range planning and real time management – for everything from curb pricing to service equity. Similarly, the EU AI Act treats autonomous driving systems as high-risk but routes them through vehicle type-approval law rather than its own conformity regimeEV98EV98EU Digital Omnibus on AI — High-Risk Obligations Delayed to December 2027 and August 2028; AV-Specific Carve-Out Confirms Sectoral Channel — 7 May 2026EU regulatory cliff deferred; AVs continue under sectoral type-approval rather than horizontal AI Act regime; UK pathway gains 17–30 month leadOpen in the Evidence Base →, with the aligned requirements not due until August 2028; neither route specifies the city-level operating data that local authorities need to govern fleet operations. In the United States, there is no federal data-sharing framework for autonomous vehicle operations at all.
Helsinki’s Whim was an innovative integrated mobility service. The platform failed not because the technology was inadequate but because no authority had the power to require operators to share data or coordinate on standards. Each operator maintained proprietary systems and could opt out of the platform whenever it chose. There is a clear pattern: siloed agencies, closed data systems, and optional participation in data sharing.
3.6The Governability Stack
The Governability StackGovernability StackThe four-layer model the paper uses to organise what cities must govern: Flows (movement), Space (kerb, road, depot), Power (grid and energy), Data (sensing and authority). Each layer has its own institutional surface and timescales. (Ch.3.) maps the relationship between four domains – Flows, Space, Power, Data – and four kinds of instruments that cities can use to manage them – Sensing, Rules, Economics, Design. 2 The instruments correspond to the four imperatives of Adaptive Urbanism: cognitive, institutional, economic, and design. Cities must learn to govern across the Stack as a single, integrated surface rather than as four separate problems managed by four separate agencies. Chapters 5, 6, and 7 work through the columns in sequence.
Although most governance frameworks treat multi-agency coordination as an obstacle to minimize, it is fundamentally important in the context of CAM. Coordination is the only way to address the Stack’s interdependence. Some models already exist (Chapter 2), and cities have an opportunity to continue building them intentionally for CAM before default operating conditions become the norm.